Data Collection
|
I used a collection of field plots (n=1635) in the Yukon’s Arctic region and a subset of field plots (n=808) and 808 (n=808) random plots located in a mapped region of the study area (see Figure 3) . Field plots were sampled between the 1960’s to 2015 (Ecosystem and Landscape Classification Program 2017). Each plot is assigned to an ecosystem, bioclimatic zone and subzone in the Yukon Bioclimate Classification System developed for Yukon’s Arctic region (MacKenzie et al. 2017). Each random point was assigned to a Predictive Ecosystem Map using the raster extraction tool in ArcGIS 15.1 to assign the raster-based ecosystem map pixel to a field plot or random point. A list of codes and names of each ecosite is given in Table 2. A list of predictive ecosystem map (hereby, PEM) codes and corresponding name used in this study are listed in Table 3. The code and name for each bioclimate subzone is listed in Table 4.
Table 2. List of ecosites codes and corresponding name.
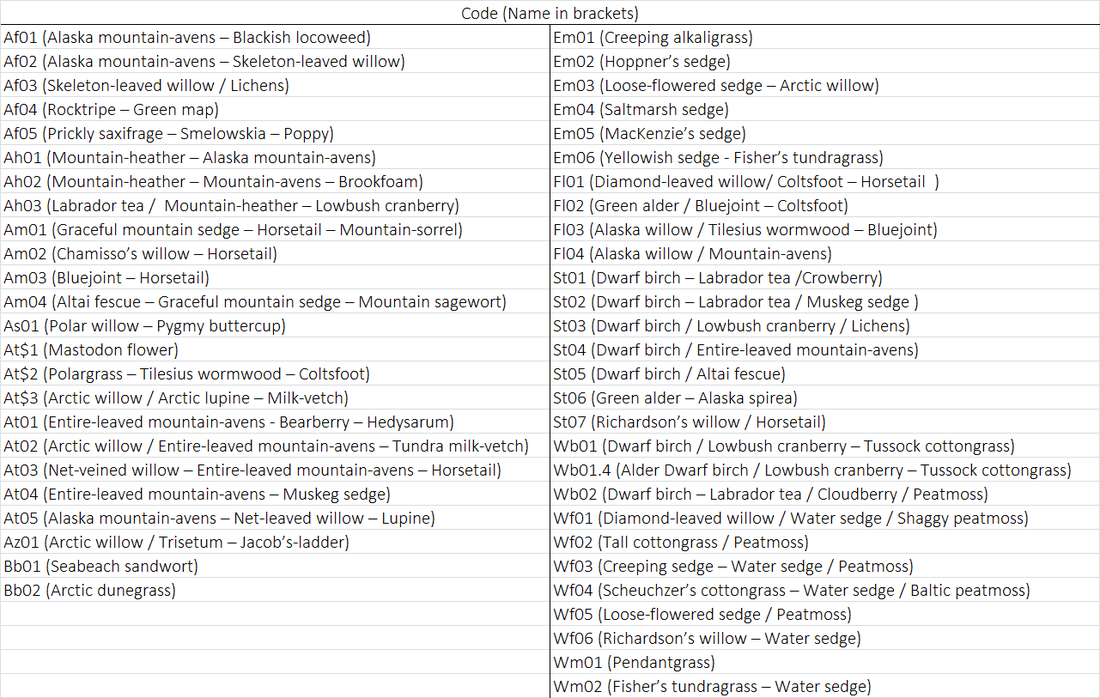
Table 3. List of predictive ecosystem map codes and corresponding name.
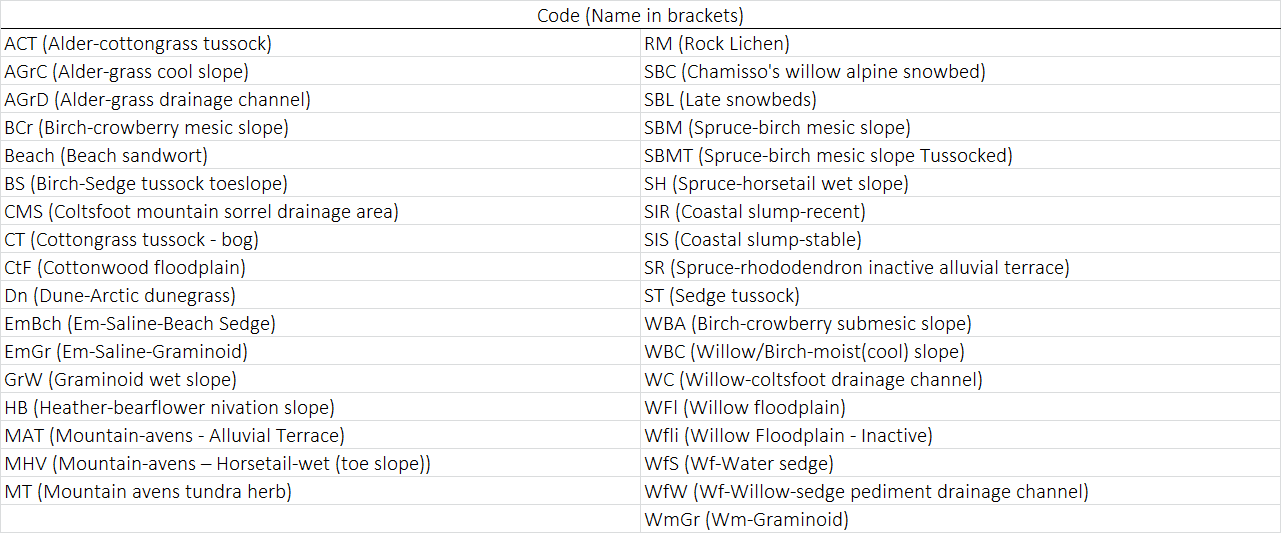
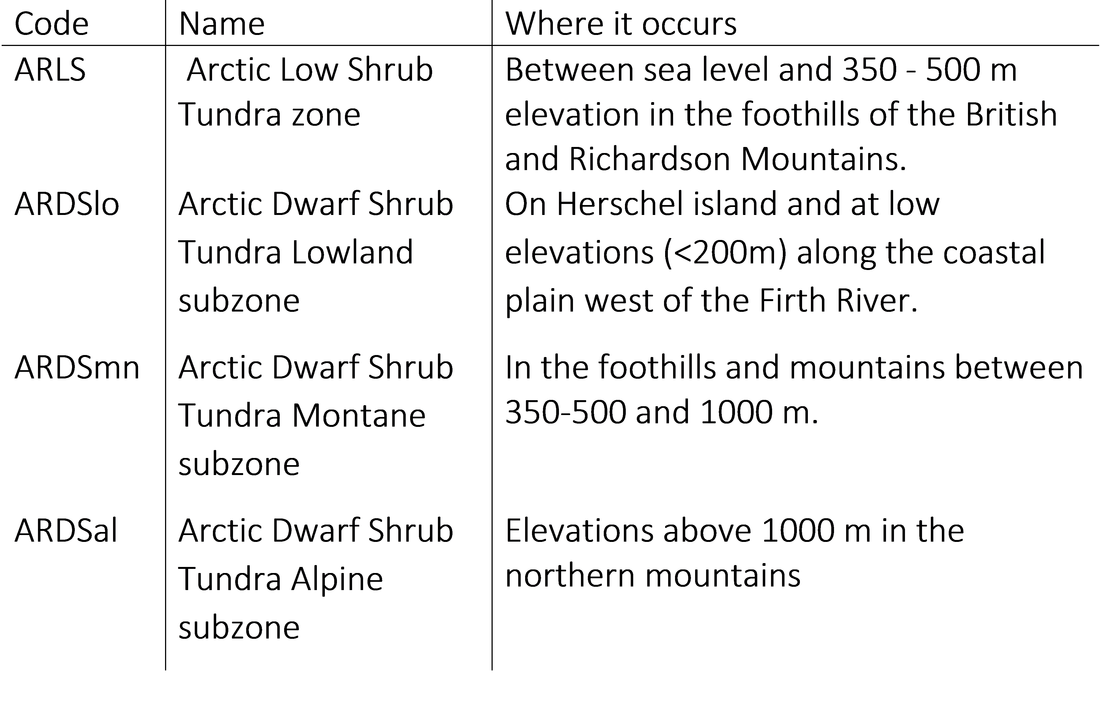
Table 4. List of bioclimate subzones and corresponding name.
|
The geographic extent of the plot coverage coincides with a predictive ecological map based on the bioclimatic classification and plot data. The study area and distribution of field plot data is shown in Figure 3.
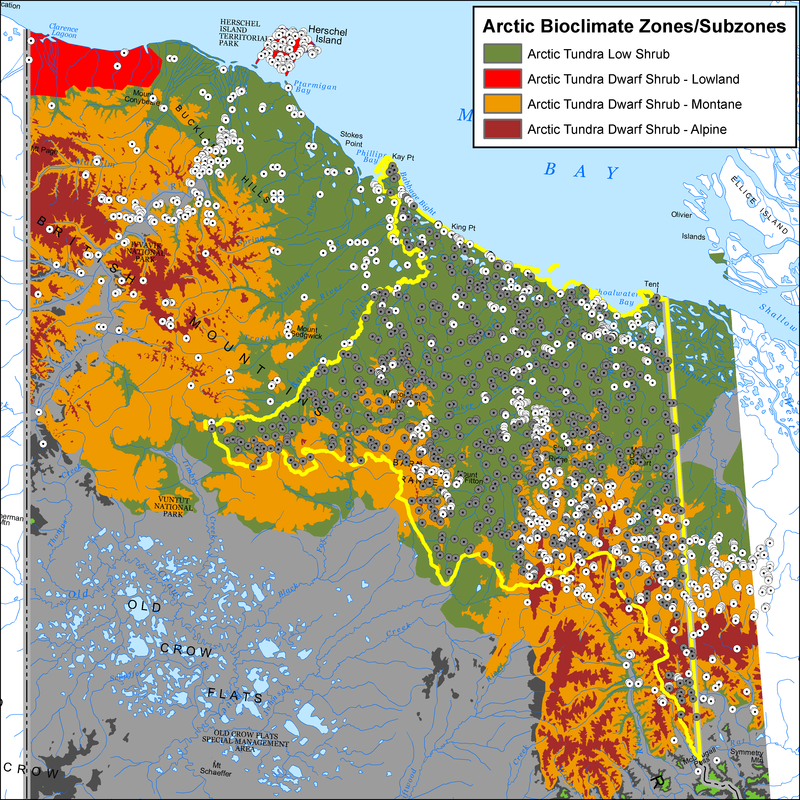
Figure 3. The study area set the arctic region of Yukon, Canada (yellow outline) showing plots (white dots with black centres), randompoints (gray dots with black centres) and bioclimate subzones.
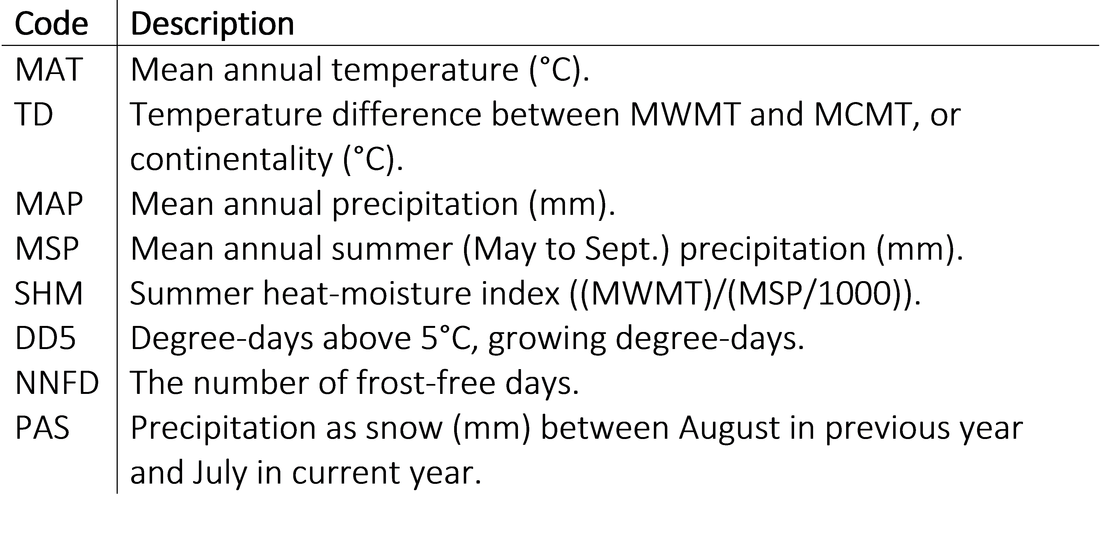
For field plots and random points, climate variables at the resolution of 4 x 4 km were generated based on the downscaling algorithms developed for ClimateWNA (Wang et al 2012) for the reference normal period 1961-1990 and 1980-2010, and three future periods 2025,2055 and 2085, hereby reference climate period. The future climate data was generated based on an ensemble of 29 climate change scenarios from IPCC Fifth Assessment Report (IPCC 2014). Climate models were not averaged to allow the full range of possible variation to be used. Eight climate variables for reference and future climate periods are listed in Table 5. This study focused on MAT and MAP to describe the bioclimate envelope.
All statistical analysis was done using R 3.4.1 (R Core Team 2013). The population of field plots and random plots is considered representative of the broader population of ecosystems.
Table 5. ClimateWNA (Wang et al 2012) variables used to describe bioclimate envelopes for arctic ecosyste
|
