Data Presentation
A table showing a summary of descriptive statistics describing the mean and standard deviation for climate normal and future climate scenarios by bioclimate subzone in provided in Table 7.
Table 7. Summary data showing means and standard deviation (in brackets) for climate variables for two Climate Normal periods (climate normal 1961-91 and 1980-2010) and two Climate Change Scenarios using 29 models. Climate data was generated in ClimateWNA (Wang et al 2012) for n=915 field plots sampled across Yukon’s four arctic bioclimate subzones.
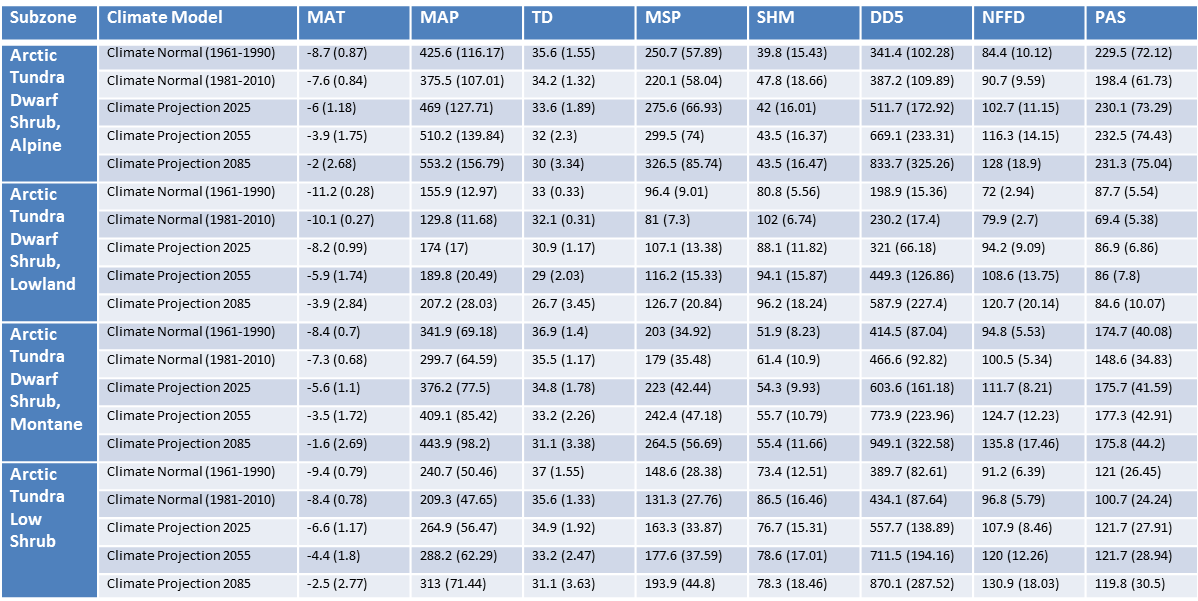
Of the eight climate variables presented in Table 7, five variables MAT, MAP, MSP, DD5, NFFD are trending towards an increase over all periods. Climate variables TD, SHM and PAS do not appear to change. The variables that appear to increase are direct or derived measured of heat while SHM and PAS are moisture driven. TD is a measure of continentality.
Descriptive statistics using 95% confidence ellipses and boxplots are presented in this section as a preliminary analysis of trends and patterns of climate variables with plot and random data presenting ecosites, ecosystem map units and bioclimate zones. Confidence ellipses in this context are used to describe variation of MAP and MAT show the region within which 95% of the samples are contained. The bioclimate envelope for field observations in the Arctic and by subzone, showing 95% confidence ellipses, are shown in Figure 5 and 6. A boxplot shows the distribution of data using the minimum, first quartile, median, third quartile and maximum. Figures 7 and 8 show a series of boxplots comparing the relationship between climate variables MAP and PAS for two periods (climate normals and future climate) by ecosystem unit and bioclimate subzone. Ecosystems do appear to vary in response to MAT and PAS. Other climate variables examined, but not presented here, show a similar pattern of variability with climate. For future cliamate scenarios ecosystems and bioclimate zone trend toward an increase in temperature, and interestingly, completely outside the range of variability of maximums and minimums. A similar treatment for PAS shows little change in the variable response to a climate change projection. In both MAP and PAS, the relative relationship between ecosystems and bioclimate subzone do not appear to change with future climate scenarios.
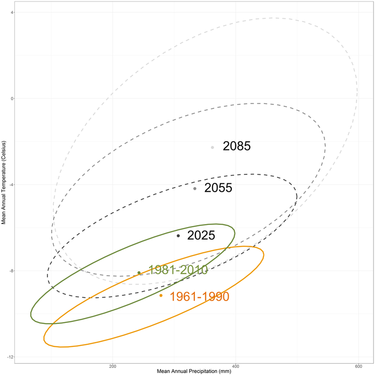
Figure 5. Mean climate of ecosite plots in the Yukon arctic region are shown with 95% confidence ellipses for 2 climate periods (1961 - 90 and 1981-2010). Expected shift of mean point for climate periods, using the range of 29 climate change scenarios, is indicated by 95% confidence ellipses for periods 2025, 2055, 2085.
|
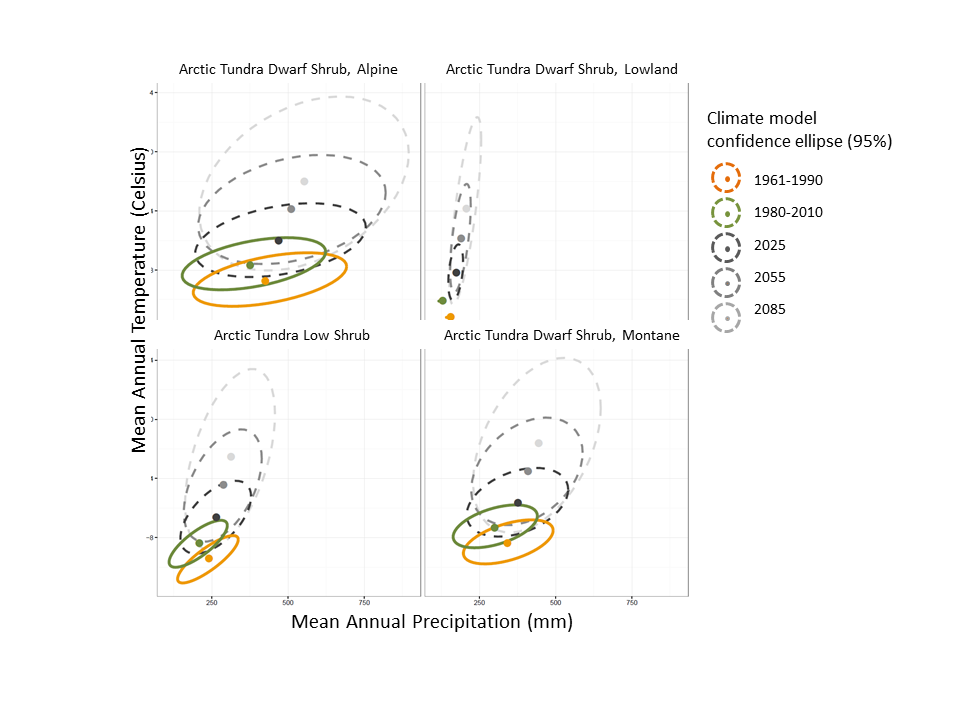
Figure 6. Mean climate of ecosite plots in the Yukon arctic region by Bioclimate Zone and Subzone are shown with 95% confidence ellipses for 2 climate periods (1961 - 90 and 1981-2010). Expected shift of mean point for climate periods, using the range of 29 climate change scenarios, is indicated by 95% confidence ellipses for periods 2025, 2055, 2085.
|
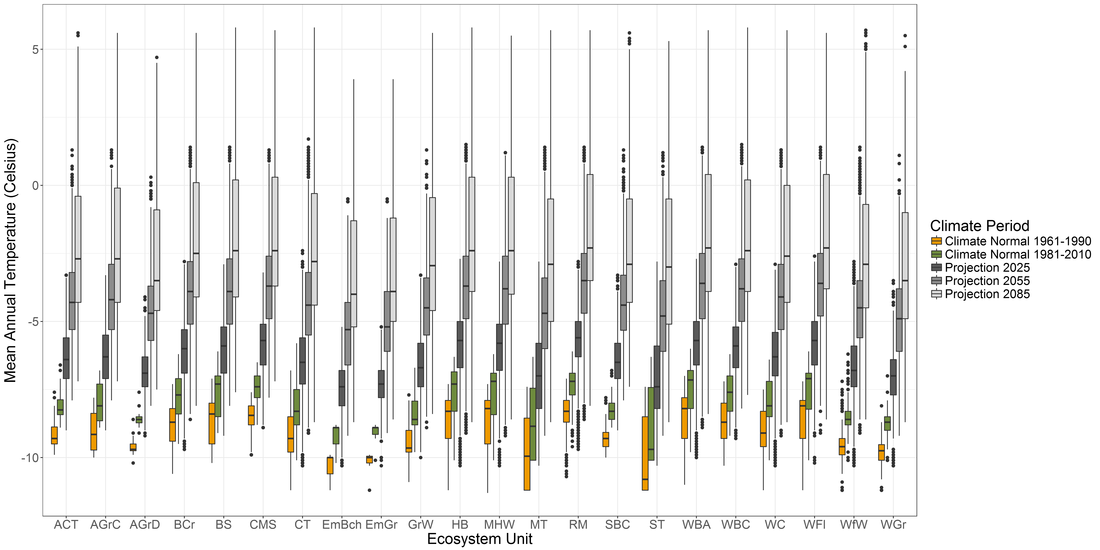
Figure 7. Boxplots comparing the relationship between Mean Annual Temperature for two Climate Normals (1961-91/1980-2010) and three climate projections for 2025, 2055 and 2085 (combined 29 models) by ecosystem unit.
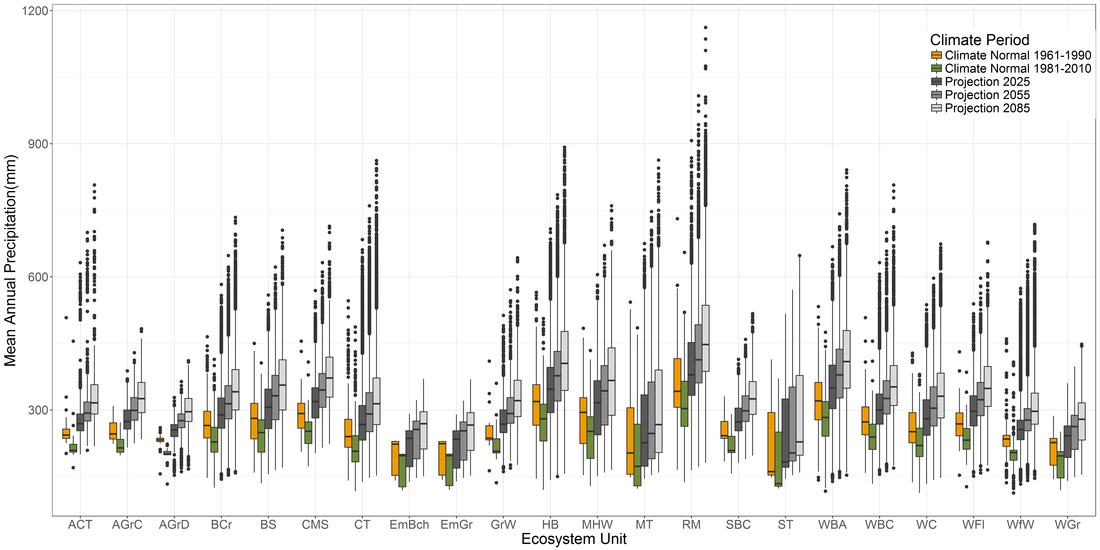
Figure 8. Figure 8 Boxplots comparing the relationship between Mean Annual Precipitation for two Climate Normals (1961-91/1980-2010) and three climate projections for 2025, 2055 and 2085 (combined 29 models) by ecosystem unit.
The MAT climate variable was used to analyze the relationship between plot and random and climate characteristics as MAP shows a similar trend. Figure 9 and 10 show a series of boxplots comparing bioclimate envelope for MAT by ecosystem type for field plots and random locations for bioclimate subzones Arctic Tundra Low Shrub; Arctic Tundra Dwarf Shrub,Montane and Arctic Tundra Dwarf Shrub, Alpine. Arctic Tundra Dwarf Shrub lowland was not used as there were too few plots in the areas of map coverage. The results however are not clear. My hypothesis was that the climate characteristics of the field plots would be similar to random locations. Some ecosystem types appear to have good agreement with reference and future climate while others do not. There also seems to be cases that the ecosystem type is not present in the bioclimate zone while the field plot is present.
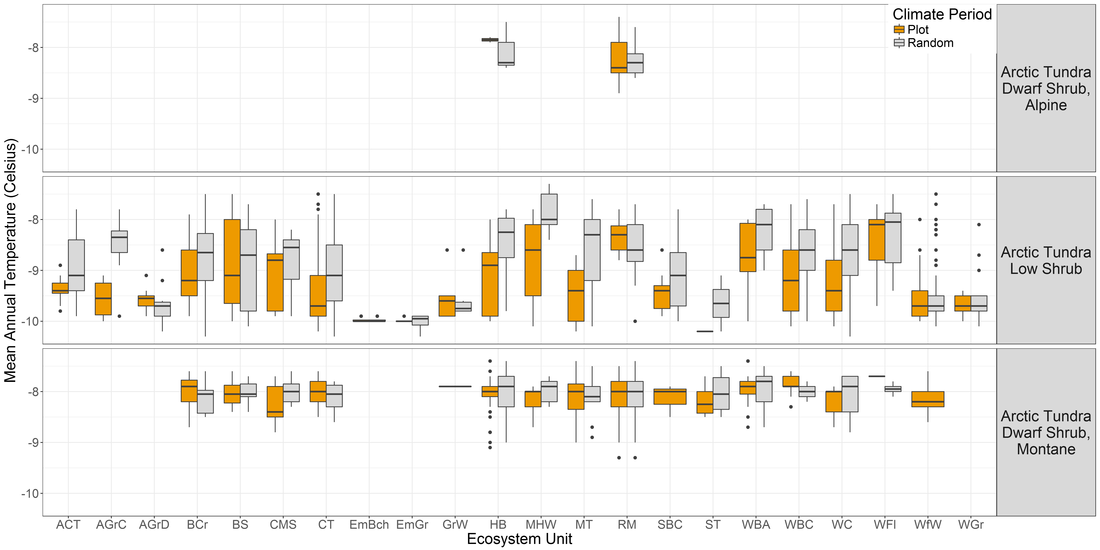
Figure 9. Boxplots of Mean Annual Precipitation by Predictive Ecosystem Map unit for field plots and random locations by bioclimate subzone within the ecosystem map study area.
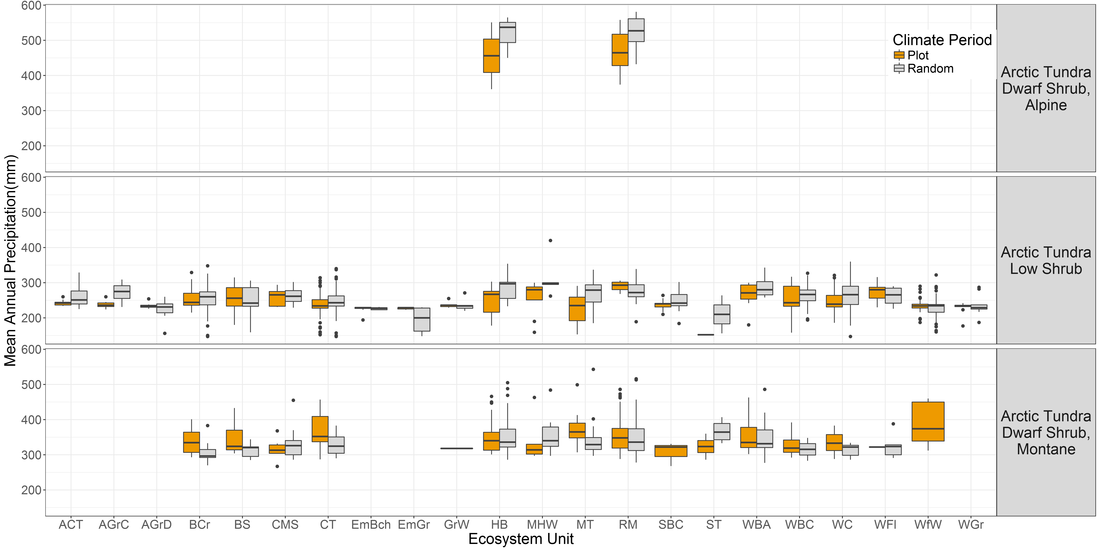
Figure 10. Boxplots of Mean Annual Temperature by Predictive Ecosystem Map unit for field plots and random locations by bioclimate subzone within the ecosystem map study area.
