Exploratory Graphics
|
Figure 4 compares the relationship of the eight climate variables to each other for climate normal 1961-90 period. The biplot shows that overall the climate variables are not highly correlated to each other, with the exception of MAP with MSP, SHM, PAS and PAS with SHM,MSP. The four bioclimate zones in the study area are indicated by colour (Arctic Tundra Dwarf Shrub, Alpine in brown, Montane in orange, Lowland in red and Arctic Tundra Low Shrub in green.) .
|
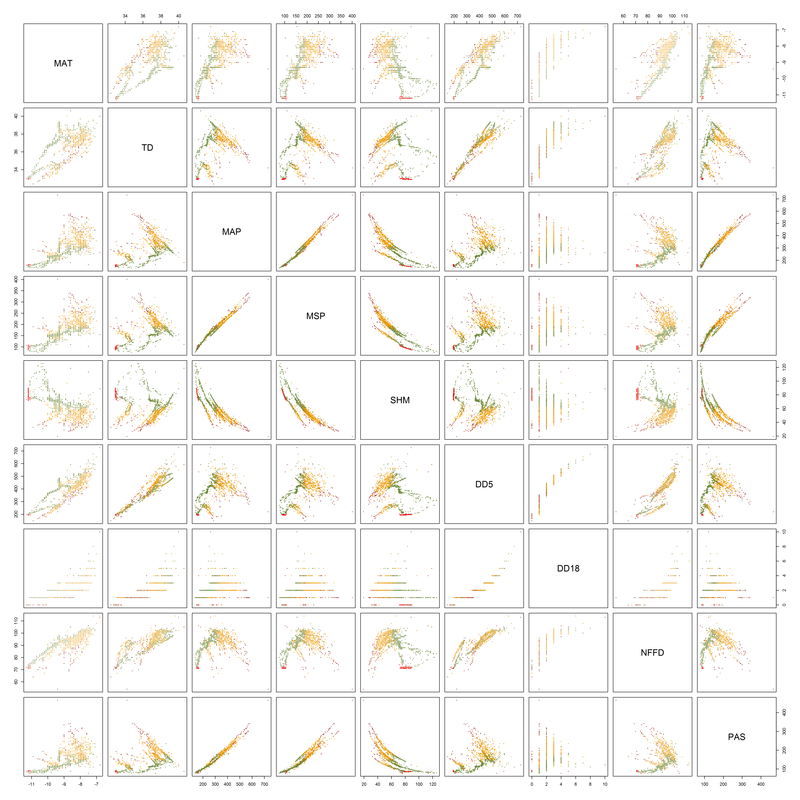
Figure 4. Biplots showing relationship of the eight climate variables to each other for climate normal 1961-91 generate data using ClimateWNA (Wang et al 2012) for 1635 plots sampled across Yukon’s four arctic bioclimate subzones.
|
