Results & Discussion
1. Do field verified ecosystems differ in their climatic relationships at a regional scale?
|
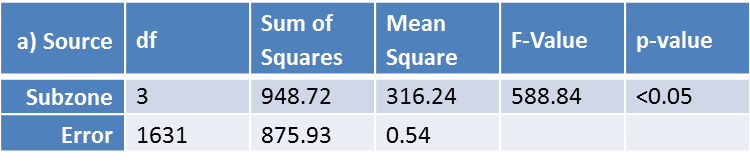
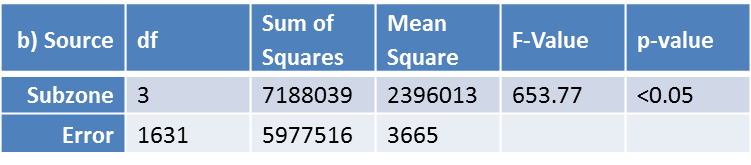
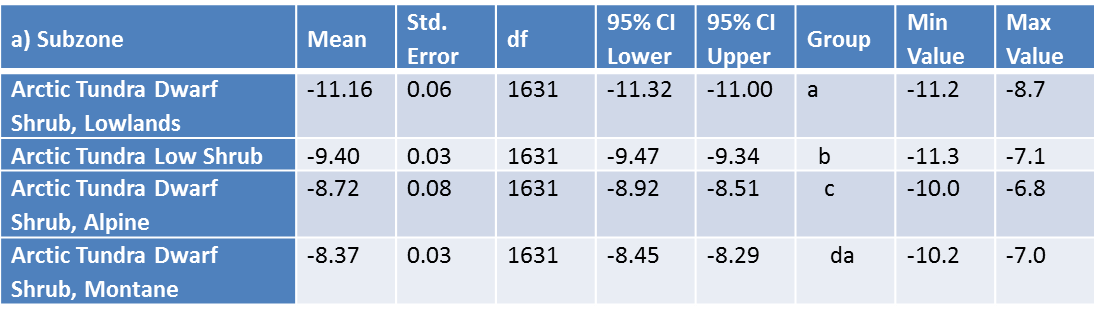
A one-way between subjects Analysis of Variance was conducted to compare 1961-1990 Climate Normals for Mean Annual Temperature (MAT) and Precipitation (MAP) associated with ground plot for four Subzone types (Arctic Tundra Dwarf Shrub - Lowland, Montane, Alpine and Arctic Tundra Low Shrub) in the study area (Table 8). There was a significant effect of Subzone on MAT and MAP at the p<.05 level for the four subzones [F(3,1631) = 588.84, p < 0.05]. Post hoc comparisons using the Tukey Honest Significant Difference (HSD) test indicated that the mean score for MAT and MAP for all subzones were significantly different (Table 9).
|
These results suggest that there is a relationship between MAT and MAP (collectively the bioclimate envelope) and subzone. Specifically, my results suggest that there is reason to conclude that subzones are differentiated along climatic gradients. The next step is to determine if a differentiation in bioclimate enveloped holds true for a projected future climate scenario.
|
Table 8. Results of a Analysis of Variable comparing 1961-1990 Climate Normals for a) Mean Annual Temperature (MAT) and b) Precipitation (MAP) associated with ground plot for four Subzone types (Arctic Tundra Dwarf Shrub - Lowland, Montane, Alpine and Arctic Tundra Low Shrub).
|
|
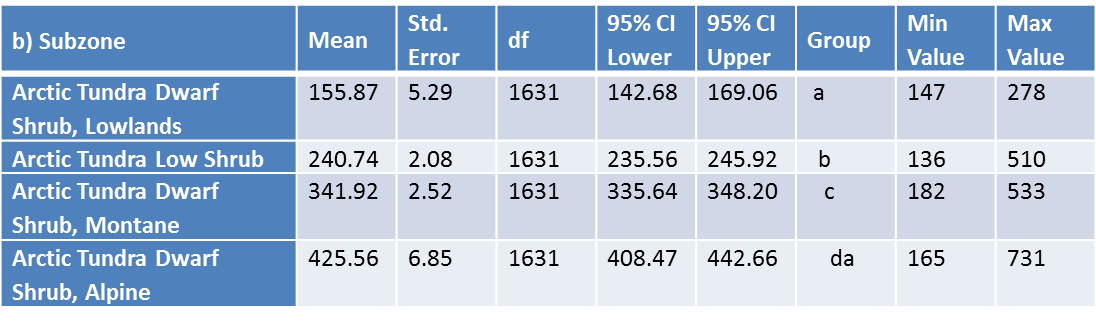
Table 9. Post hoc comparisons using the Tukey Honest Significant Difference (HSD) test indicated that the mean score for MAT and MAP for all subzones were significantly different.
|
|
2. Does a recent climate period differ from a projected future climate for the bioclimate subzone using field verified ecosystems at a regional scale?
|
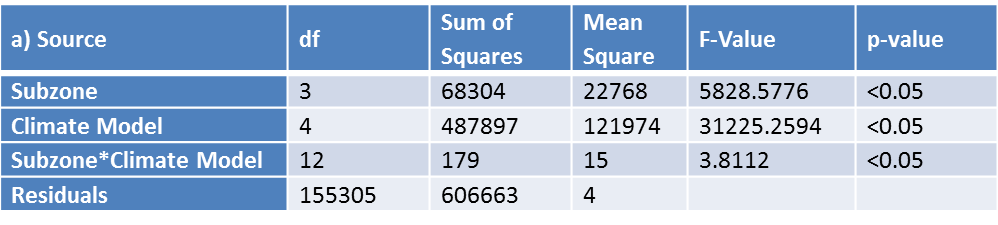
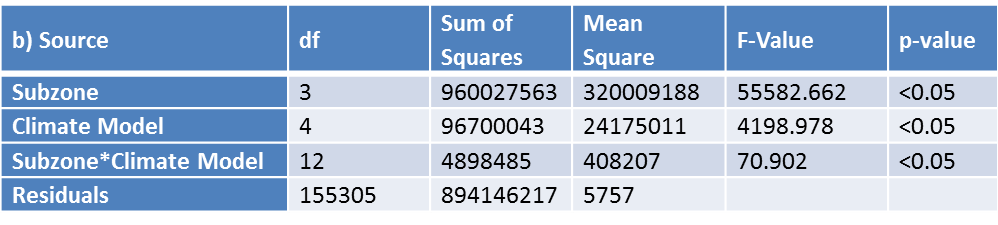
A two-way between subjects Analysis of Variance was conducted to compare Climate Envelopes for 2 Climate Normal periods (1961-1990 and 1981-2010) and 29 assembled Climate Projection Models for Mean Annual Temperature (MAT) and Precipitation (MAP) associated with ground plot for four Subzone types (Arctic Tundra Dwarf Shrub - Lowland, Montane, Alpine and Arctic Tundra Low Shrub) in the study area (Table 10). There was a significant effect of Subzone and Climate Model on MAT and MAP at the p<.05 level for the four subzones [F(3,12) = 5828.5776, p < 0.05], [F(3,12) = 55582.662, p < 0.05]and [F(4,12) = 31225.2594, p < 0.05], [F(4,12) = 4198.978, p < 0.05](Table 10) . Post hoc comparisons using the Tukey Honest Significant Difference (HSD) test indicated that the mean score for MAT and MAP for all subzones were significantly different for all comparisons between subzones within each period. Mean MAT by subzone for each Climate Period with 95% Confidence Intervals are shown in Figures 11, a similar trend was found for MAP and are not shown here.
|
These results suggest that bioclimate envelopes for all five climate scenarios different between each other and by subzone. Further there is interaction between climate and subzone. These results suggest that there is reason to conclude that recent and projected future bioclimate envelopes for ecosystems within arctic subzones are significantly different. It is reasonable that bioclimate subzone differ in climatic characteristics. The climate chacteristics of plot data are also differentiated by a mapped ecosystem unit. The next step is to determine if field verified and mapped ecosystems differ in their relationship to climatic variables.
|
Table 10. Results of a Analysis of Variable comparing Climate Envelopes for 2 Climate Normal periods (1961-1990 and 1981-2010) and 29 assembled Climate Projection Models for Mean Annual Temperature (MAT) and Precipitation (MAP) associated with ground plot for four Subzone types (Arctic Tundra Dwarf Shrub - Lowland, Montane, Alpine and Arctic Tundra Low Shrub).
|
|
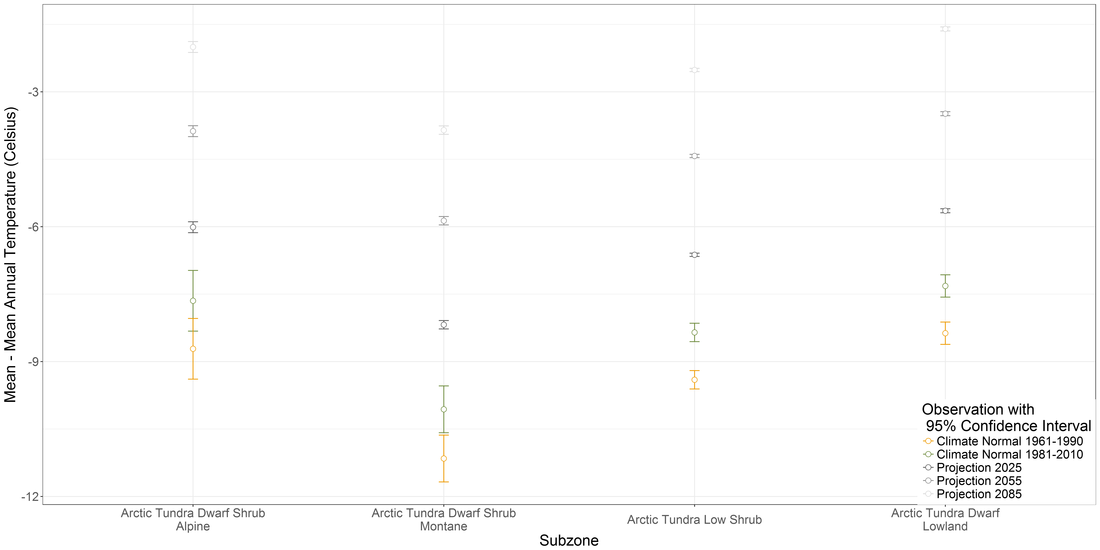
Figure 11 . Mean, Mean Annual Temperature by subzone for each Climate Period with 95% Confidence Interval bars.
3. Do field verified and mapped ecosystems differ in their relationship to climatic variables at a local scale?
|
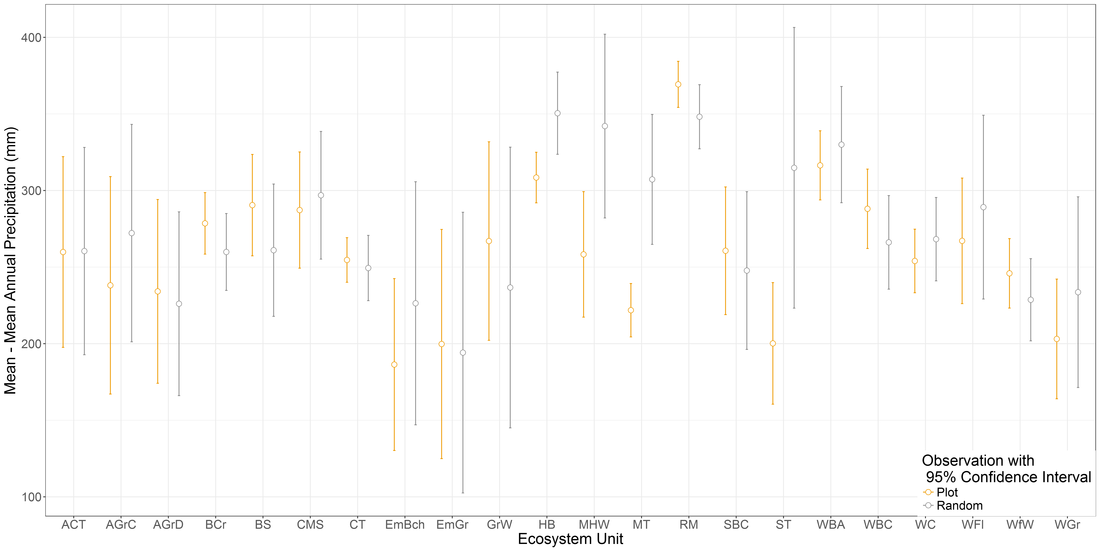
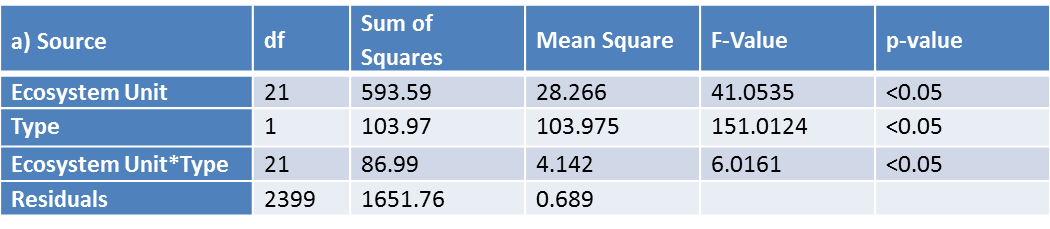
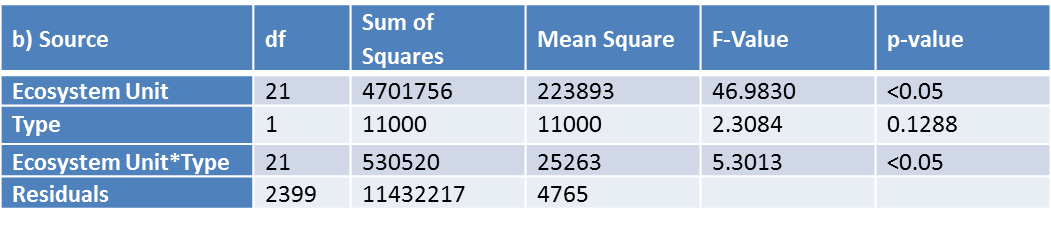
A two-way between subjects Analysis of Variance was conducted to compare 1961-1990 Climate Normals for Mean Annual Temperature (MAT) and Precipitation (MAP) associated with ground plot for two data types: field plot and random location and 22 Ecosystem Units (Table 12). There was a significant effect of Plot Type and Ecosystem Unit on MAT at the p<.05 level but not for Plot Type and MAP. Post hoc comparisons using the Tukey Honest Significant Difference (HSD) test indicated that the mean score for MAT and MAP for ecosystem Units and Type were significantly different. Ecosystem Units that did not differ between Type for MAT, were RM and WfW and ACT, CMS, GrW and SBC for MAP. Mean MAT and MAP by Ecosystem Unit for each type with 95% Confidence Intervals are shown in Figures 12 and 13.
It is counter intuitive that the overlapping confidence interval are significantly different under the HSD test. This is likely the result of the adjusted p-value for multiple tests, in effect lowering the risk of making a Type I error (rejecting the null hypothesis when it should be rejected). These results suggest that bioclimate envelopes for most Ecosystem Units differ from each but all within the same Ecosystem Unit by Type. Type by itself however did not differ. This can be interpreted as meaning that if Ecosystem Unit variably between field plots and random locations can be ignored plot and random sites could be combined together, at least at the subzone level.
|
These results suggest that it may not be possible to infer that plot data (derived from ground observations) are drawn from the same population as random points. There are also two other possible explanations for the significant interaction between Ecosystem Unit and Type. First, the ecosystem map, the source of Ecosystem Unit for random Types, is in error. The ecosystem map is predictive in nature and relies upon the predictive relationships between ecosystems and the inputs used to model them. The classification accuracy of the PEM is approximately 65%. It may be possible to use the pixels accuracy (probability of being true) to weigh its contribution of the climate variable to the measure of the bioclimate envelope. Secondly, it is possible that the ecosystem map units are correct but the field data simply doesn’t cover enough of the variability to capture the true climatic relationship of the ecosystem types.
|
Table 12. Results of a Analysis of Variable comparing Climate Envelopes for Ecosystem Units (n=22) and location Type (plot vs rand0m) for a) Mean Annual Temperature (MAT) and b) Precipitation (MAP).
|
|
Figure 12 . Mean, Mean Annual Temperature for Ecosystem Units by location Type (random vs plot) and 95% Confidence Interval.
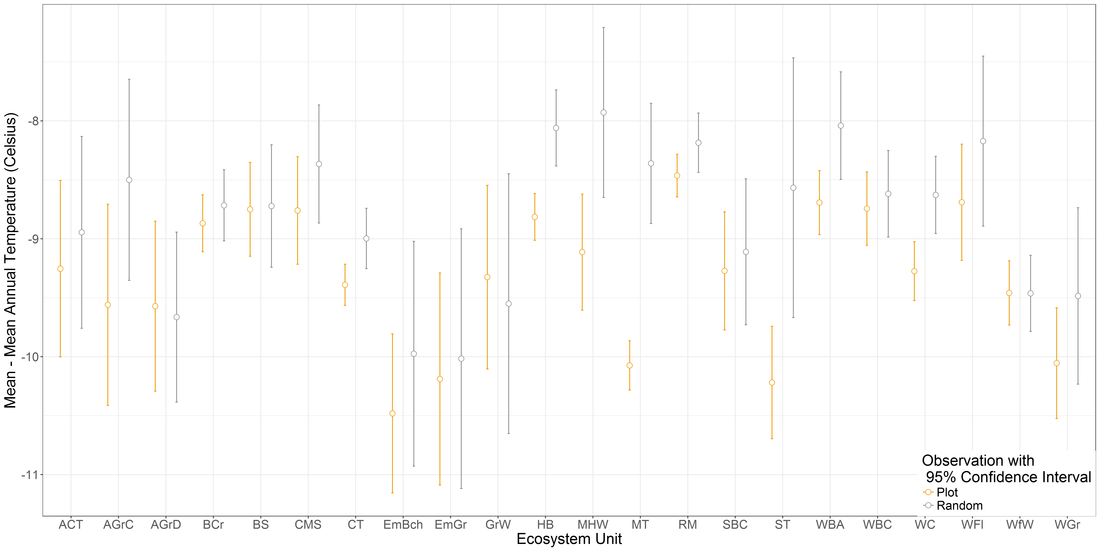
Figure 13 . Mean, Mean Annual Precipitation for Ecosystem Units by location Type (random vs plot) and 95% Confidence Interval.