Data Table
|
Ecological plot data was collected in the field by a variety of field observers over several decades. Data cleaning however was minimal as all data was stored in a standard database designed to hold ecological data with standardized fields and species names. All plots have complete species lists but at times not all species were identified to genera, particularly many Salix spp. or Willow species. Soils data were collected in approximately 50% of the ecological plots. Ecological classification was based on analysis of plant community, soil characteristics (or inferred characteristics based on plant community), parent materials, presence of permafrost and other ecological information. Bioclimate zones and subzones were mapped using a zonal concept of bioclimatic classification (citation).
|
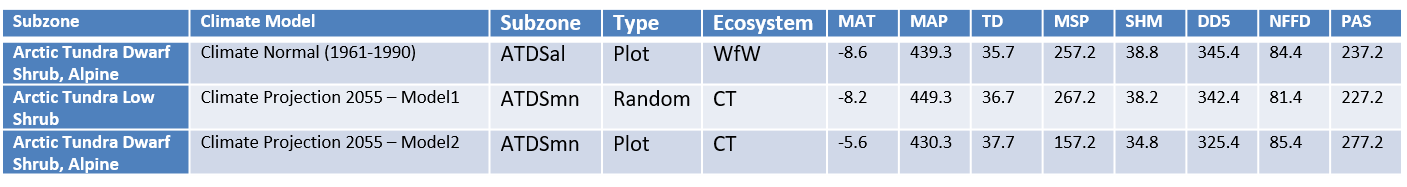
Table 6. shows an abbreviated version of the data table used in this analysis. The experimental unit is the plot location or random point location. The response variables are the Ecosystem unit, bioclimate zone/subzone. The predictor variables are observed climatic variables, generated from ClimateWNA (Wang et al 2012) MAT, MAP, TD, SHM, DD5,NFFD and PAS.
|
Table 6. An abbreviated version of the data table used to compare bioclimate envelopes of ecosystems by bioclimatic zone in Yukon’s arctic region for two climate periods.